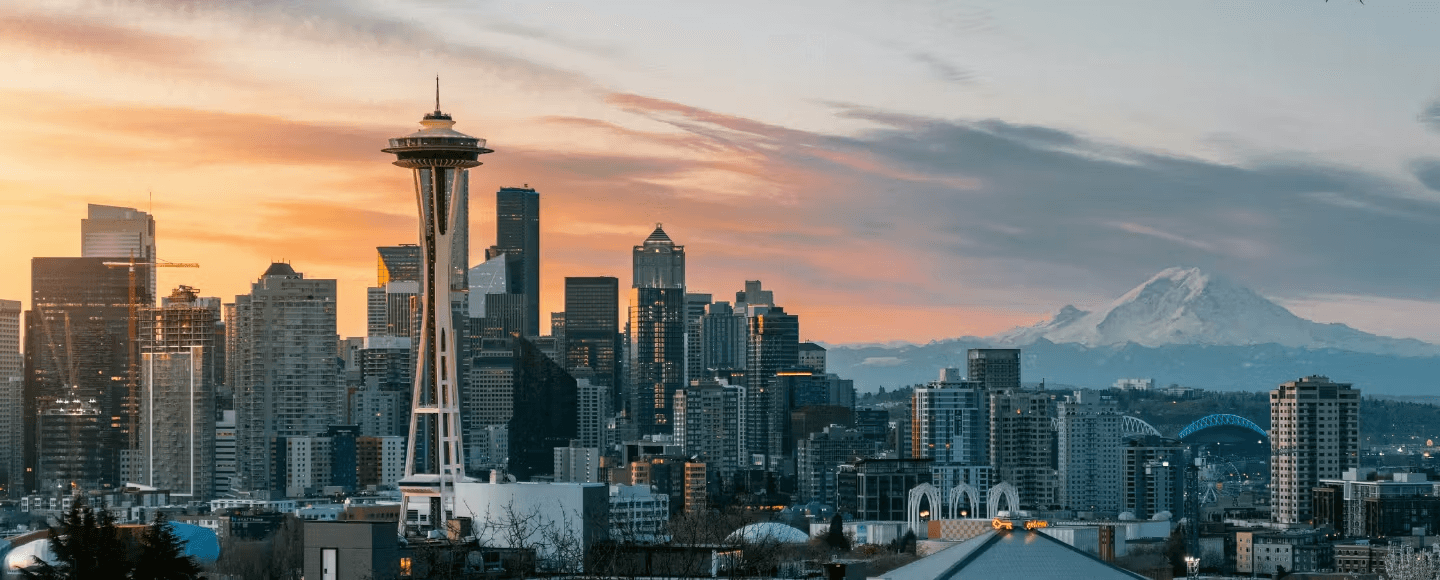
Using Predictive Modeling to Implement aData-Driven Rate Program in Seattle, WA
Seattle has actively managed parking rates since 2011, with a simple goal: keep at least one open space on the average block by pricing to demand. For years, that meant collecting citywide occupancy data by hand once a year and waiting on a review cycle that could take a full year before rates could move. Turnstone replaced the annual manual study with continuous, model-based occupancy estimates drawn from the city's own transaction data, so Seattle can read demand year-round and adjust rates while the data is still current.
Seattle's rate program was constrained by the cost of its own data. Collecting occupancy data across the city by hand was slow and expensive; council approvals further stretched the timeline, and a once-a-year snapshot could not capture how demand shifted from season to season. Rates lagged behind the curb they were meant to manage.
The supply itself was a moving target. Roughly 11,000 paid spaces go on and offline throughout the day and the year, pulled for construction, permits, parklets, load zones, and events, and the picture was scattered across more than ten separate systems. Without a single, current view of how many spaces actually existed and how full they were, pricing to a real availability target was guesswork.
Turnstone built Seattle's view of the curb from data the city already had, with no new sensors in the ground. The platform starts with dynamic supply: it aggregates all inventory sources and adjusts for spaces that come online or offline by the hour, so the count reflects what is actually available rather than a static map. On top of that, it models paid demand from meter and mobile payment transactions, layers in duration of stay, unpaid activity, and overnight vehicles, and monitors for drift as behavior changes over time. The result is an occupancy estimate for any Curb Zone or Curb Area, every day of the year, accurate to within about one car per block. With that in hand, Seattle reviews rates on a fast, repeatable cycle and adjusts against a 70th percentile occupancy target, raising or lowering by increments to hold the curb in the 70 to 85 percent band that leaves a space open.
Since 2021, Seattle has made at least three data-driven rate changes a year, keeping at least one open space on the average block across the city. For drivers, that means finding an open space on most blocks about 7 out of 10 trips, up from roughly 3 out of 10 before the program. The model estimates occupancy 365 days a year, replacing the annual manual study, and each rate review that once took up to a year now runs in as little as four weeks, a reduction of more than 92%.
In one downtown Curb Area, pricing to demand across the seasons rather than holding a single annual rate drove a 51% revenue increase for the year, adding about $55K to the general fund. That is one of the city's 33 Curb Areas.
“Turnstone gave us the tools to manage and accelerate our program.”

Seattle's program is its own, shaped by local policy and more than a decade of data, but the approach is not unique to Seattle. Any city can manage the curb using the data it already has, reading demand continuously and pricing to keep spaces open.