
Last post, we talked about the relationship between parking rate on block and demand, measured as "occupancy." If you haven't read that post yet, go do that first. If you're feeling clicked-out, you can settle for a brief recap here.
The story so far
Last time we shared examples of real neighborhoods where demand increased when rates increased. Some of those rates were quite high for municipal on-street parking, and yet elasticity still did not seem to be present. It was obvious that in those areas, demand was clearly higher than the price effect.
It's clear that the Econ 101 behavior we've all been expecting (rates go up, occupancy goes down) doesn't seem to be true.
Where do we go from here?
Try another metric
We asked: does price influence other aspects of parking behavior? What about that behavior can we measure instead?
If we've got paid parking, we have at least one piece of behavioral data built in: the duration paid on each parking event. This data comes with every transaction, and has at least some correlation with the intent of the parker. Let's assume that the vast majority of parkers purchase a duration that is a close estimate of their actual intended stay, and see what we find.
We'll look at three more neighborhoods in this post, again using real municipal parking data pulled directly from Turnstone, over the course of three years and multiple rate changes.
Duration vs rate
In this tourist area filled with stadiums, cafés and restaurants, there are close to 600 spaces and activity all day. Over the course of three years, we saw two large rate increases, and four smaller decreases. Note the trend. Duration appears to be directly correlated with rate. As rates increase, it looks like there's a reaction (that happens quickly): people buy less time at the meter.
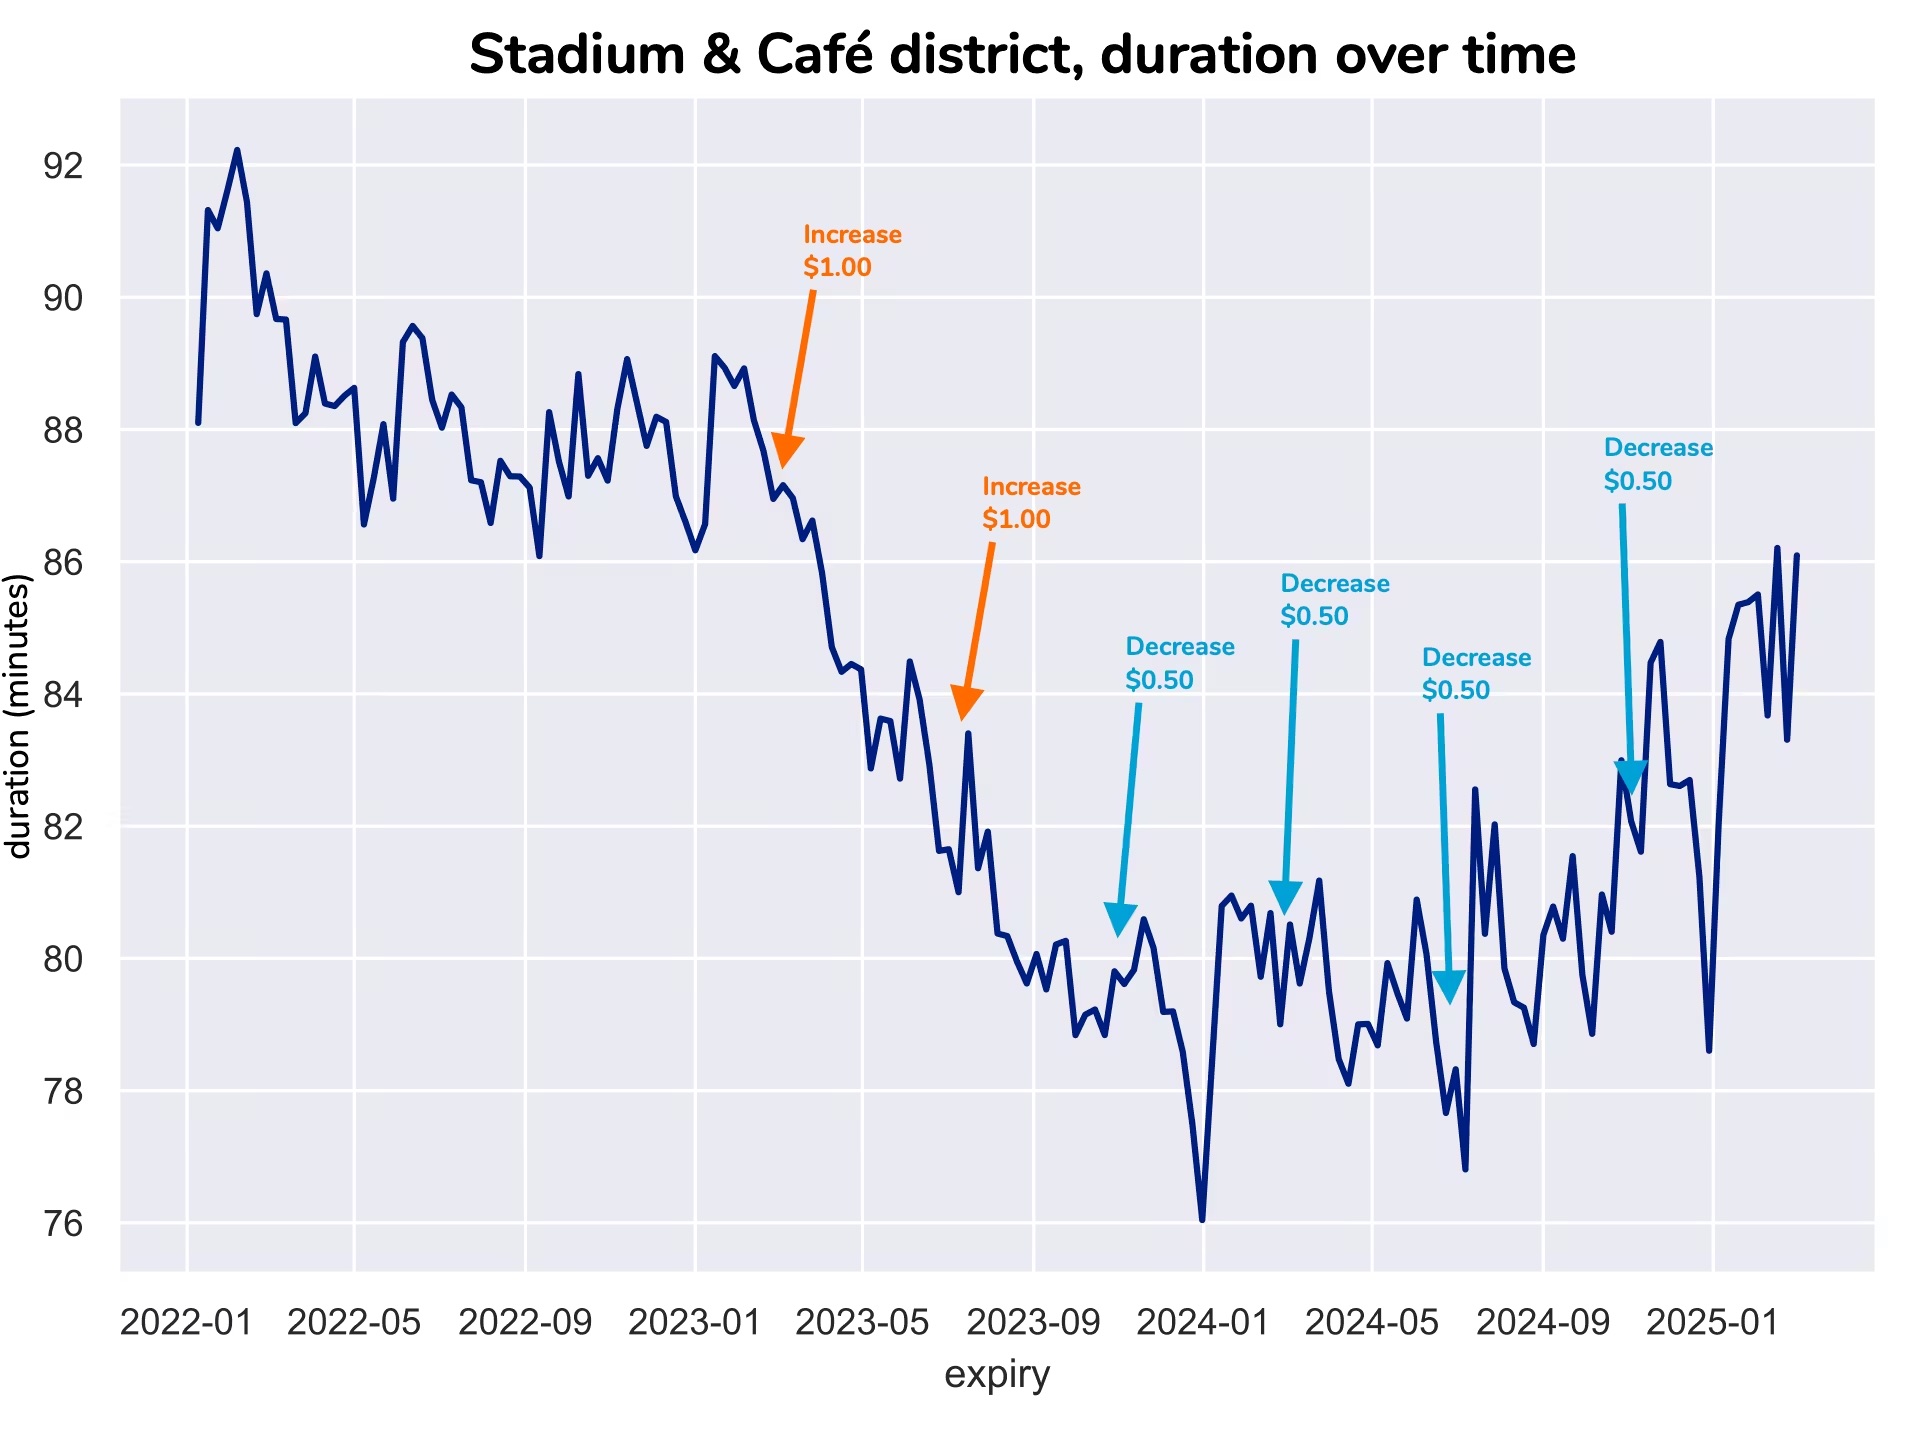
Based on what we've seen so far, this seems to make sense. It tells an interesting story, assuming it's not an edge case.
Duration, rate, and transaction counts
Here's a second area, known for retail. A few hundred spaces, also with high tourist activity. It's a dense neighborhood. Looking at the same chart (three years of transactions, duration paid plotted against the date), we see what looks like the same trend again:
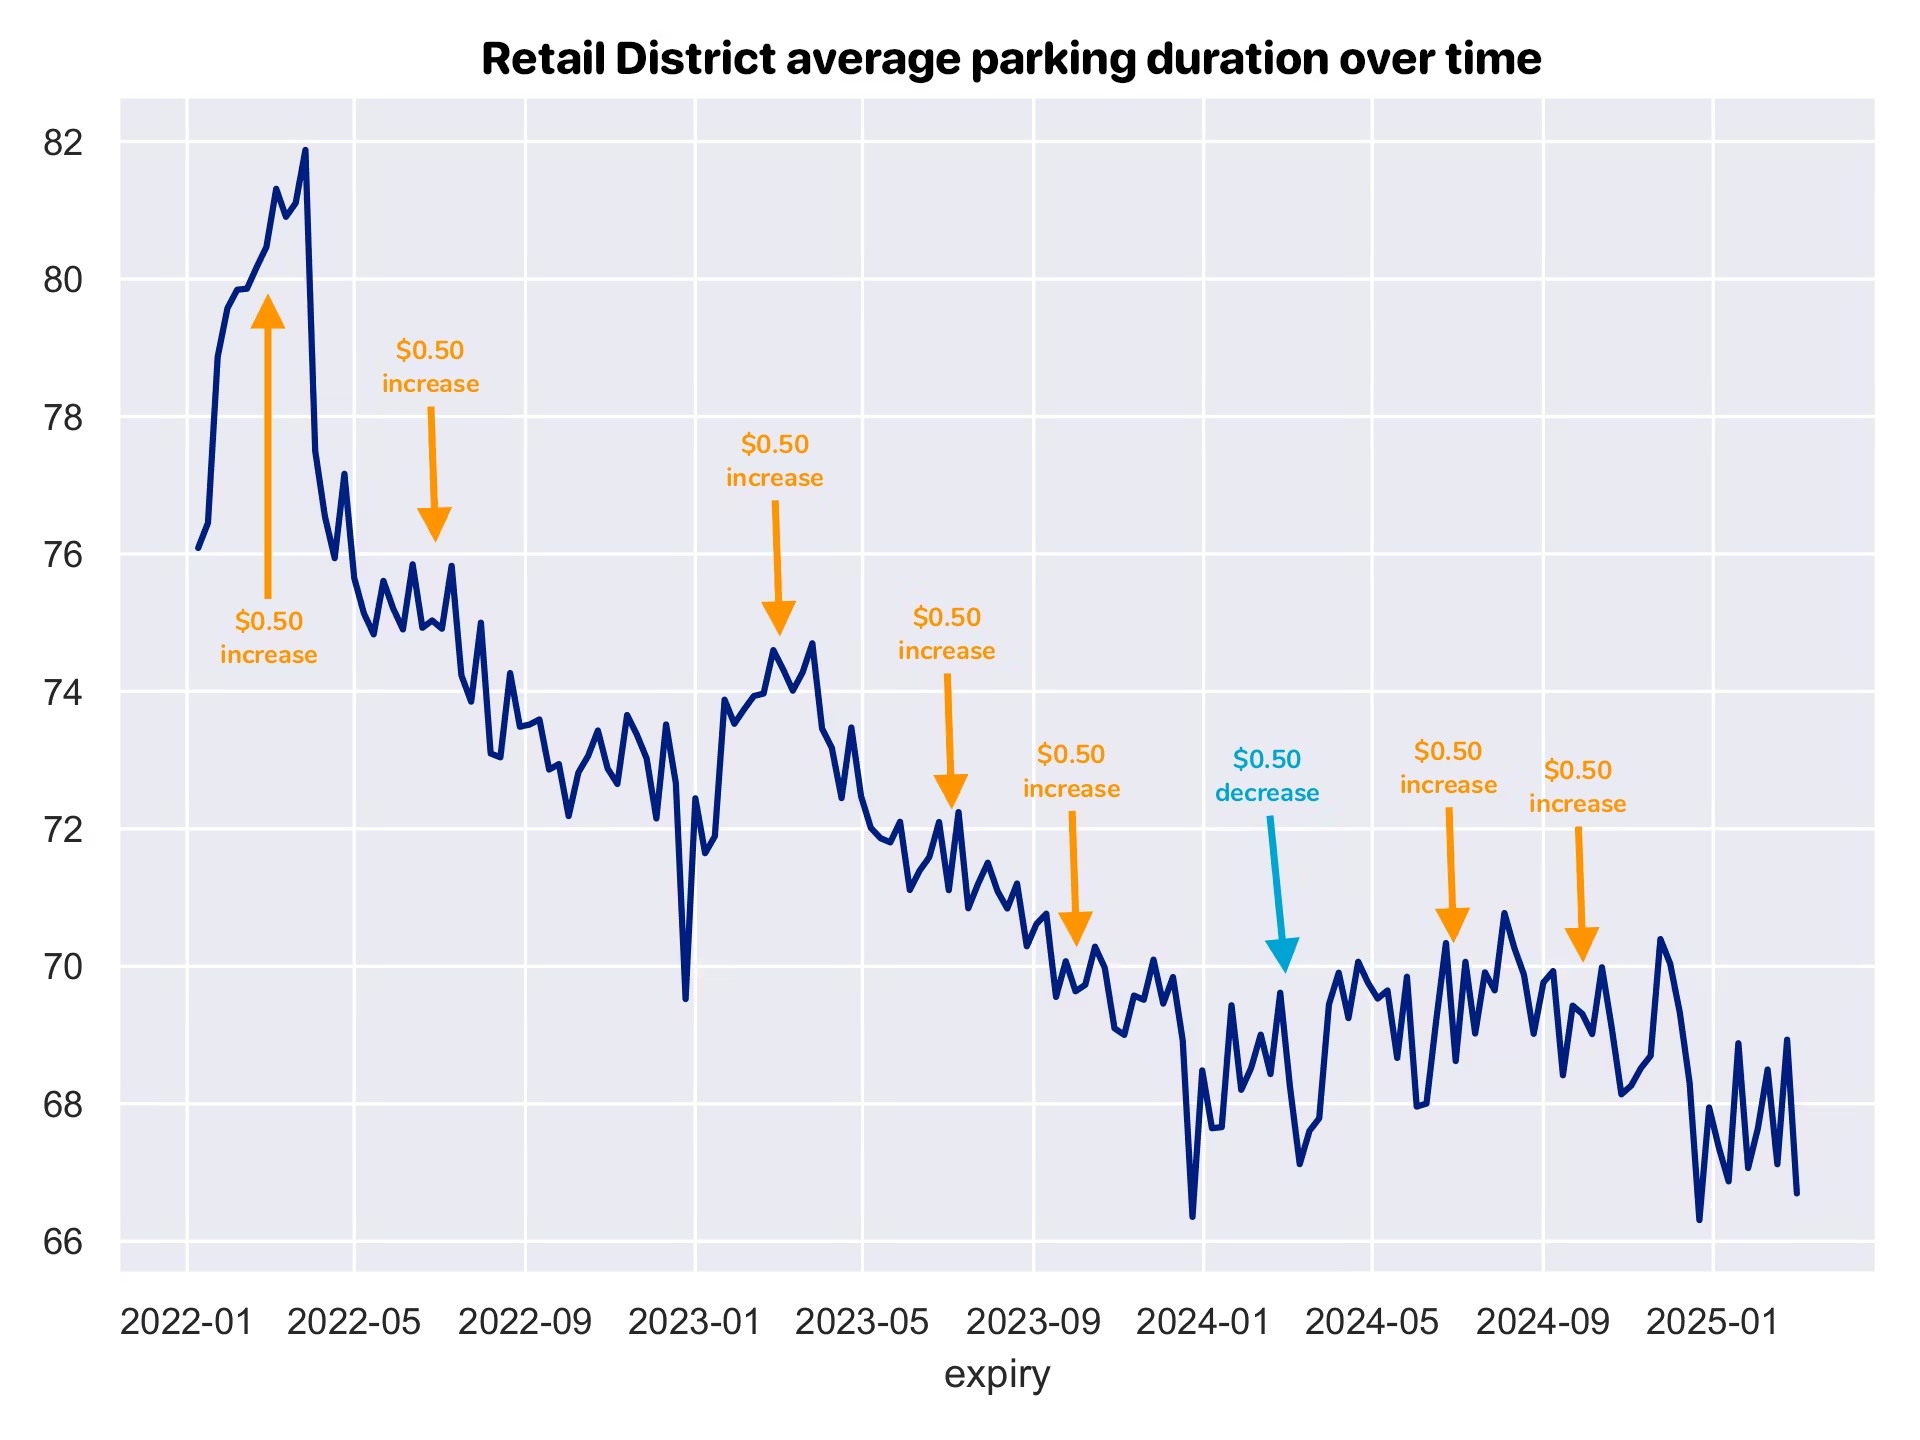
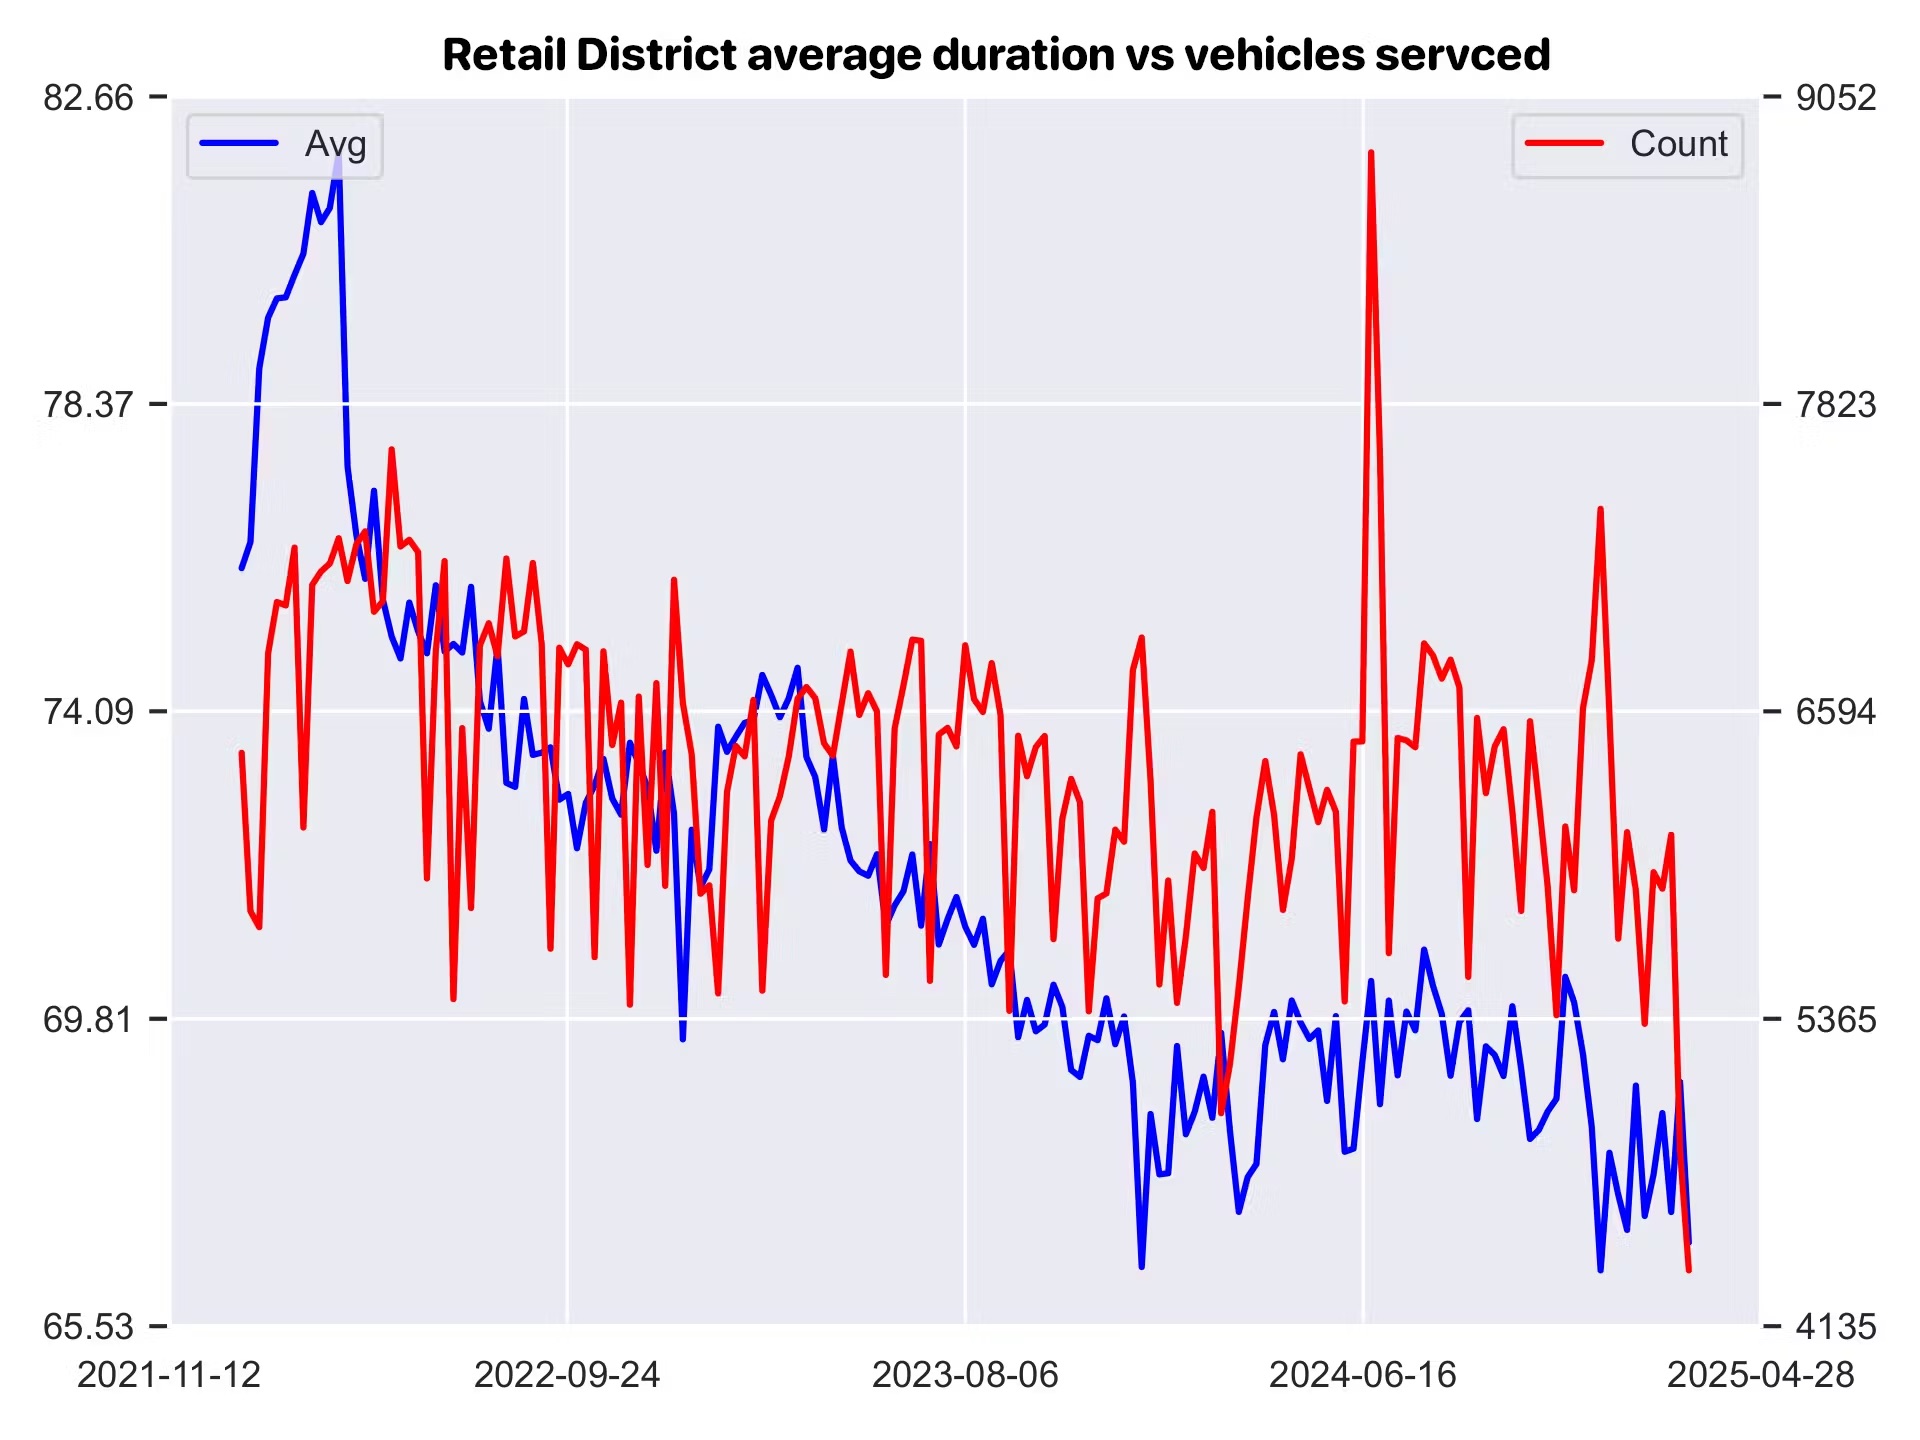
This seems to add weight to the implication that people pay for less parking when the rate is higher. Previously, we saw that occupancy didn't seem to go down when rates go up. Let's test that quickly. Looking at the count of transactions for this area over the same time period, we see that as duration goes down, the transactional trend is very minimally negative. People are still parking, just staying shorter.
Another example: there's something here
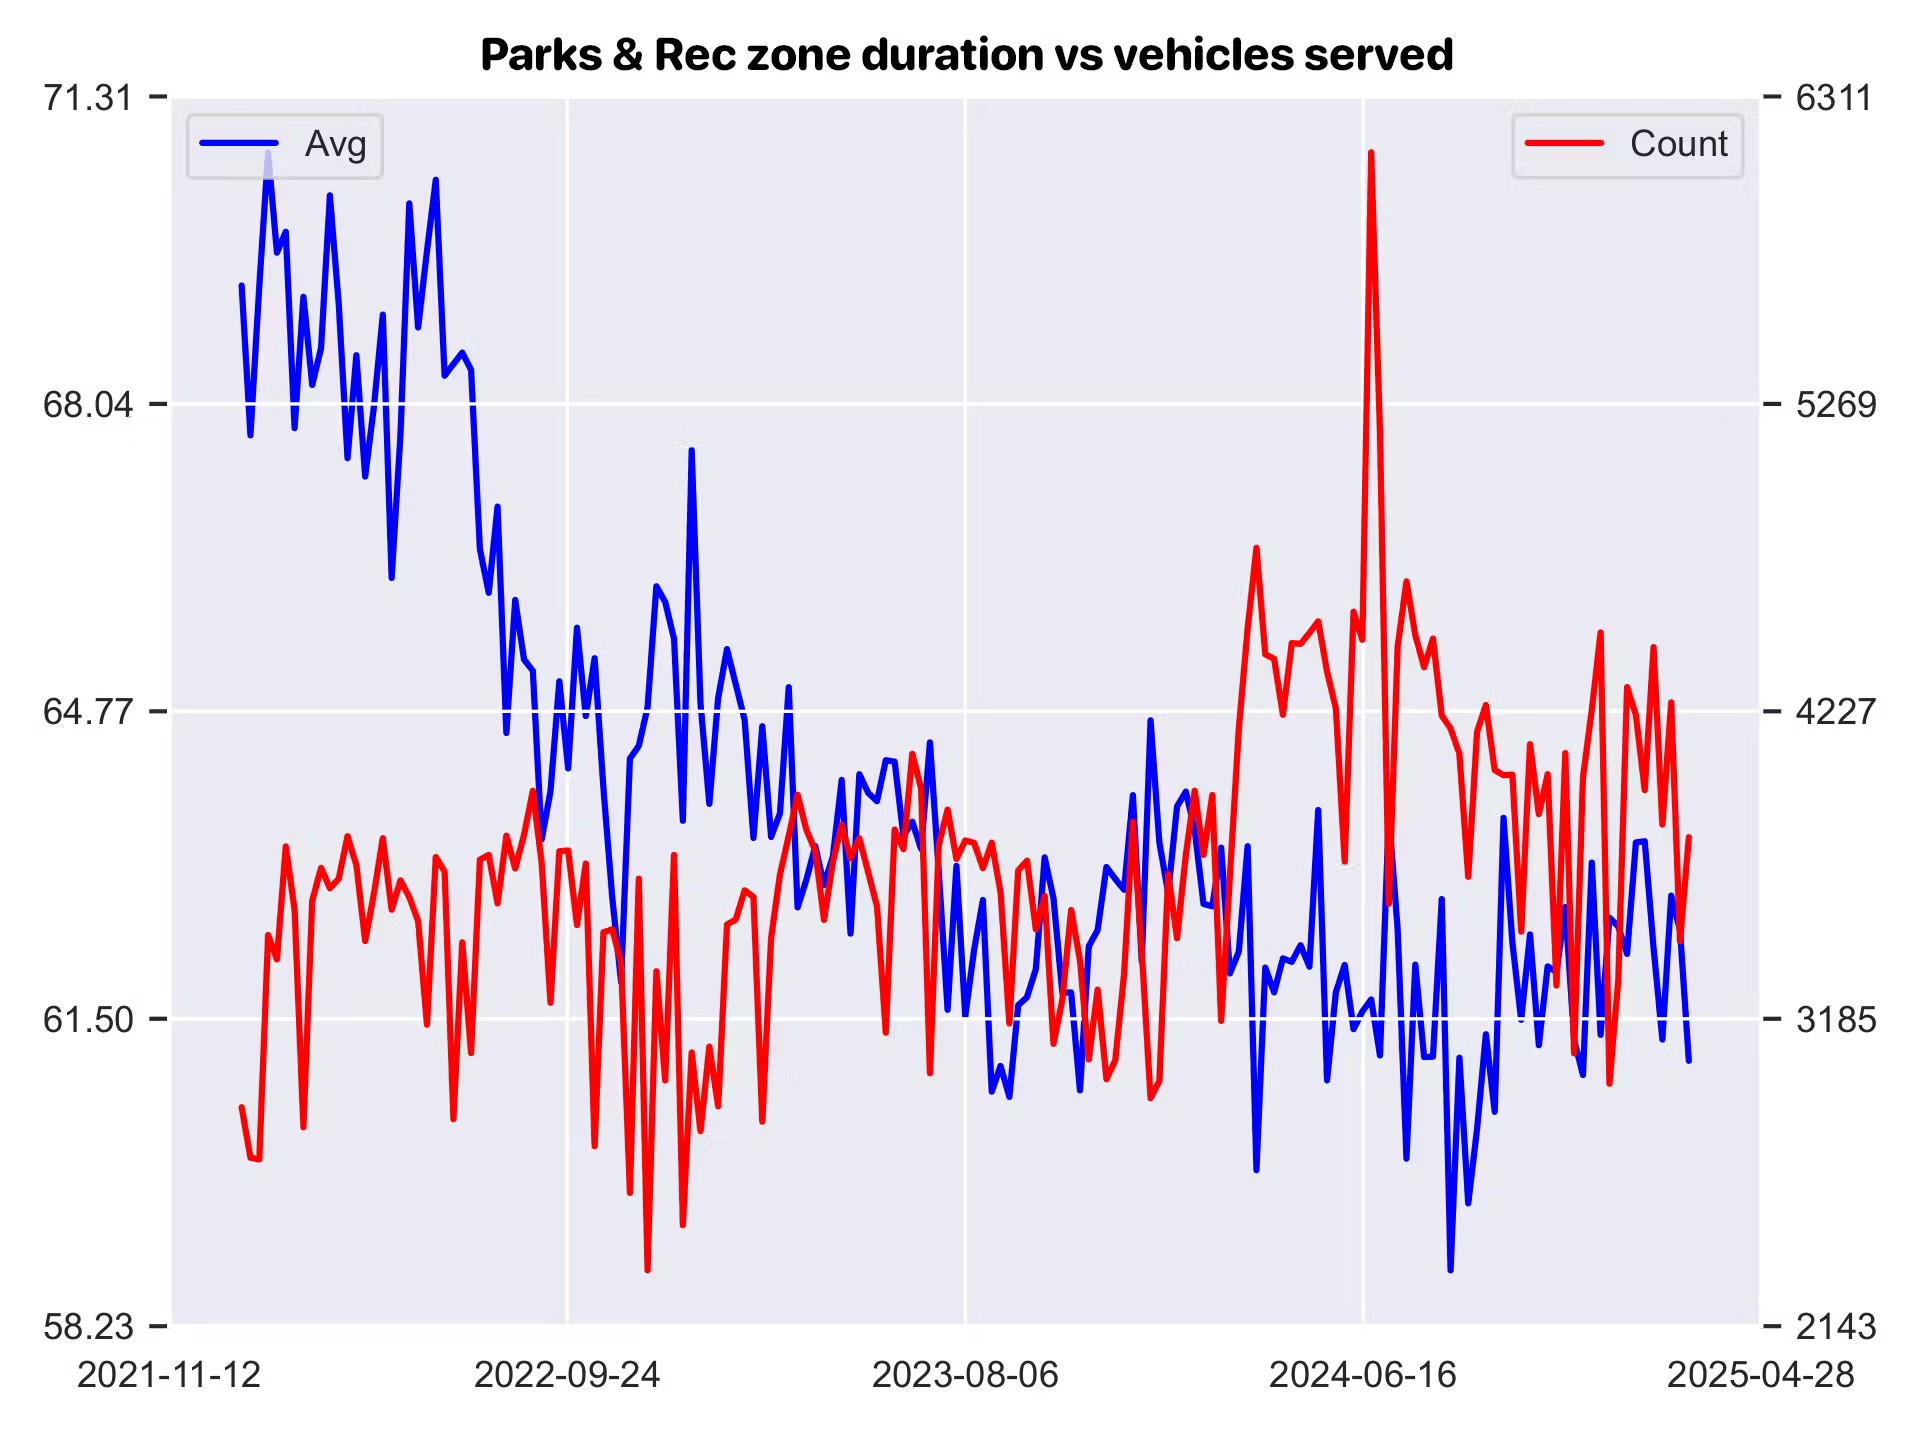
Let's do another. This time, we'll use an area we looked at in the first post: the Parks and Rec area. Last time we saw occupancy went up when rates increased to $4.50 per hour. Looking at duration paid over the same three years (2022 to 2025), we see the same pattern: duration goes down when rates go up, and up when rates reduce.
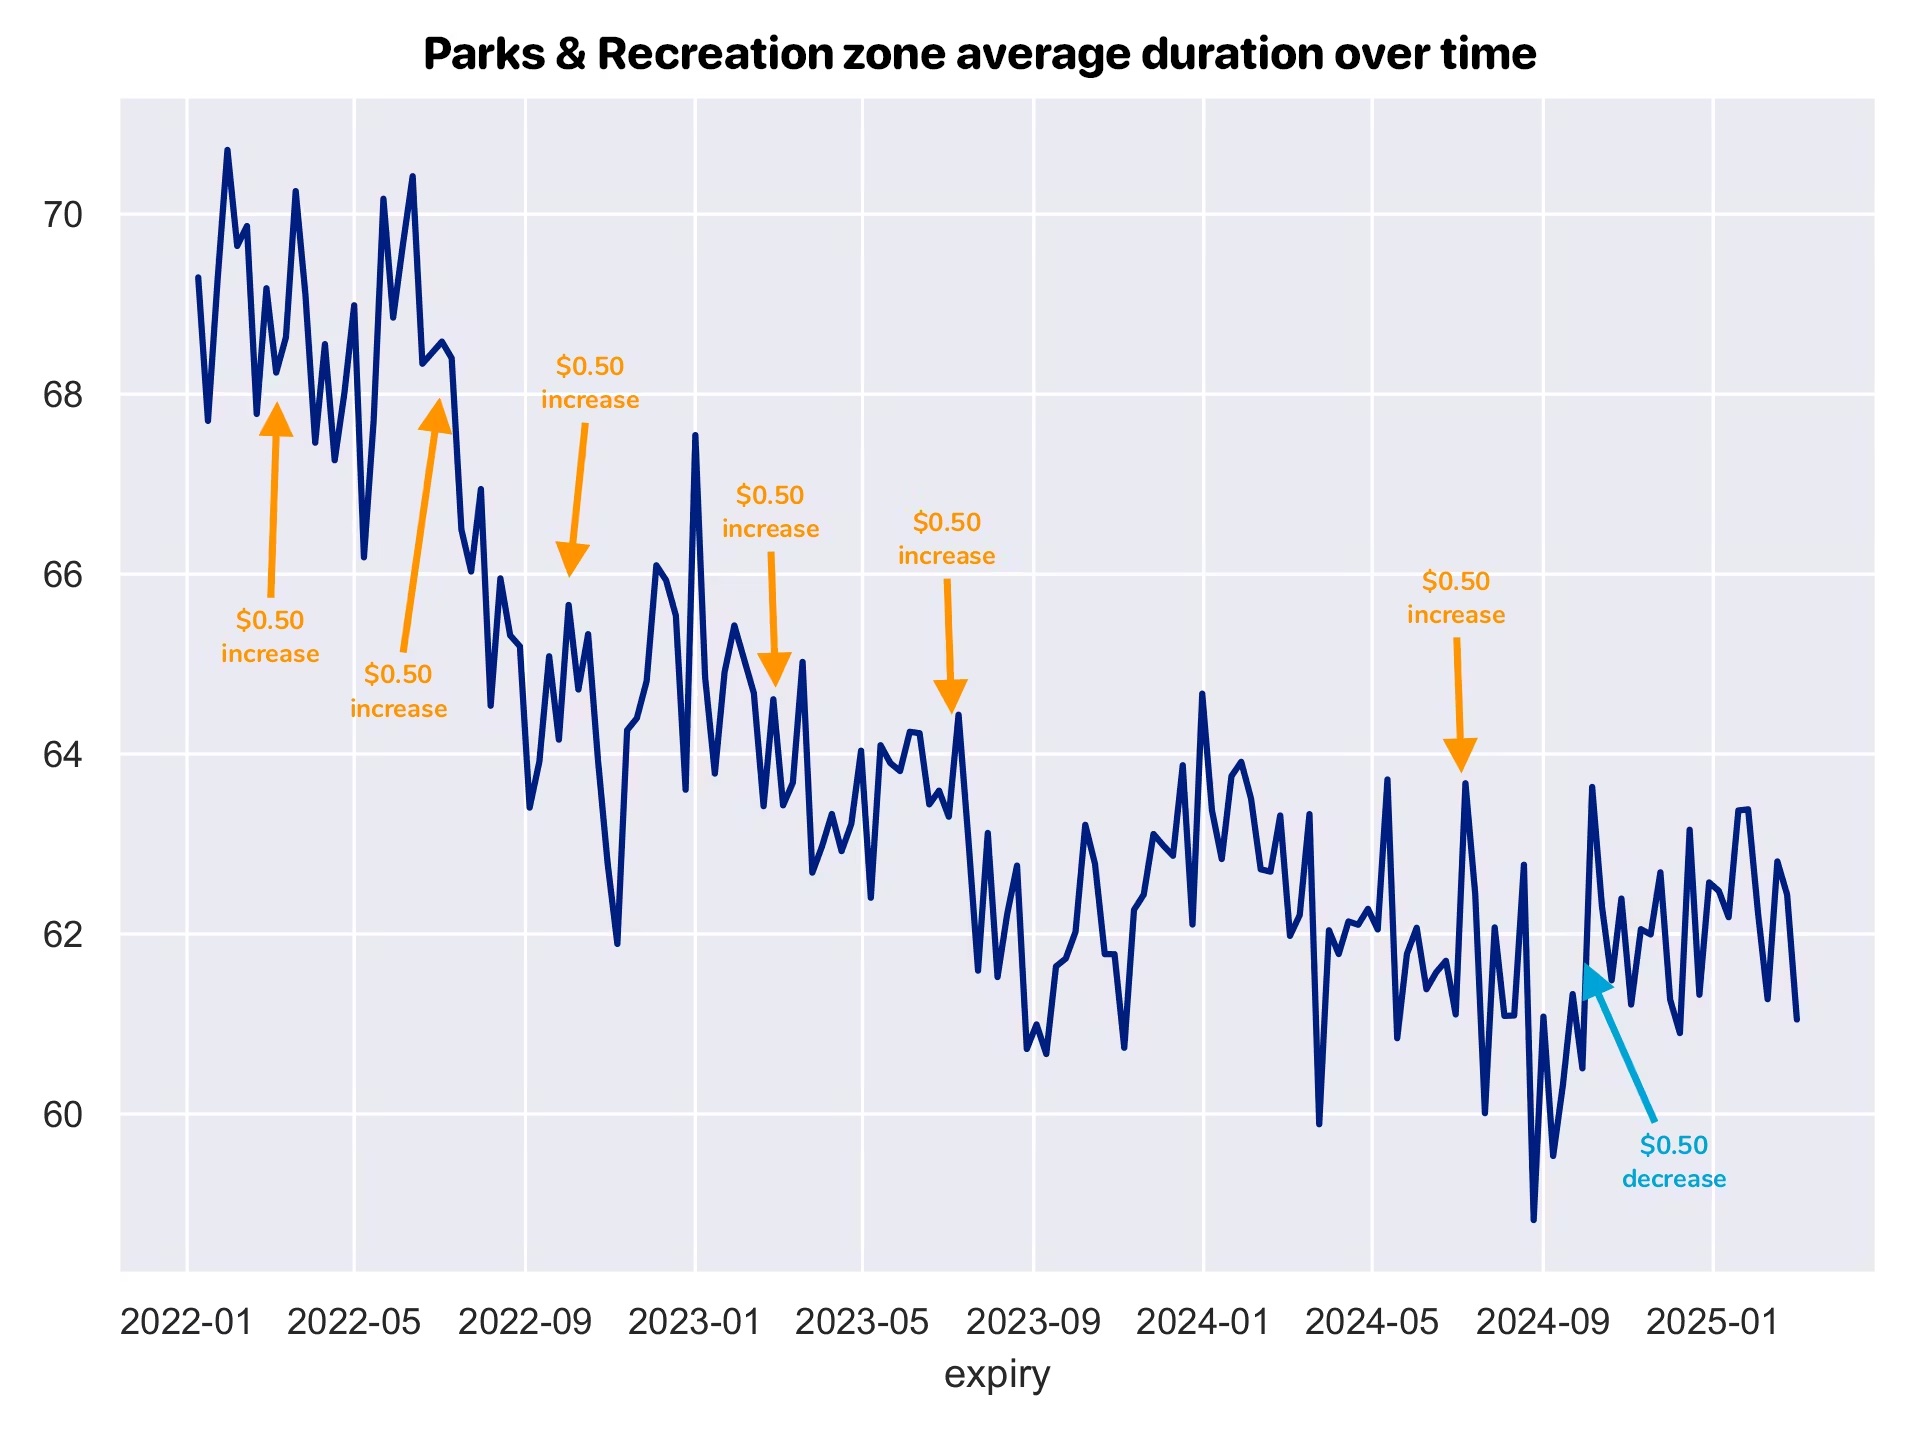
Looking at parking events, things get really interesting: the number of transactions trends upwards over time.
So, why?
When we looked at occupancy as the metric, we had some theories as to why it didn't work: maybe drivers value their time more than the dollars spent, or the price is still too low to matter. Or maybe drivers aren't aware of the price before they park (is anyone?).
It seems all of these could be correct. We've all had the experience of circling for parking and the corresponding sunk cost of finding a space. What price would it take to get us back in our cars to circle again?
Although all of this is just correlation right now, it's really interesting and plausibly explainable. Do we know rate changes cause duration changes? Not yet. But if any of us land a parking spot only to discover it's more expensive than we thought, what can we do to react? Buy less time.
More research ahead
There's more work to be done here, but it seems like there's a real link between rate and duration paid.
It would be interesting to look at actual duration of stay in these areas, before and after the duration paid changes. Were people overpaying when rates were low, cutting the duration paid closer to their actual stay as rates increased? Or were parkers always estimating well, but overstaying their payment as rates went up? We might see this play out in higher actual demand relative to paid demand.
What about compliance more broadly? When we look at the Retail district, duration goes down, and number of transactions goes down slightly. Were we truly less full? Or were some parkers risking a ticket (and keeping actual occupancy rates high) rather than paying higher rates?
So what?
We've seen that occupancy is the wrong metric when you're trying to measure rate impact, and that duration seems to relate to price. What do we do with all this?
Transit operators shifted their thinking to look at people moved rather than vehicles per hour. We need to shift our thinking, too. We don't want to throw occupancy away (it's an important secondary value) but it's time to deprioritize it, and start talking about vehicles served.
It looks like pricing might actually affect that.
Rate-based programs are not a failure. We've just been missing their impact by measuring the wrong thing.
Let's stop focusing on occupancy and start talking about vehicles served. We'll dig into that with our next post.
Want to see what duration and vehicles served look like across your own program? Book a Demo.